1.5 Adding Points and Colors to a scatter plot
Adding Points to a scatter plot
Let’s say someone found us a new penguin to add to our scatter plot. We measure its attributes and find it has a body mass of 6 kilograms and a flipper length of 0.22 meters. Following the pattern we used earlier to create the scatter plot (Y ~ X), we can overlay a new dot on the scatter plot using a pipe operator (%>%). The pipe operator tells R to overlay the point on top of the existing plot instead of making a new plot. Note that we colored the new dot red to distinguish it from the data points in the penguins data frame.
gf_point(body_mass_kg ~ flipper_length_m, data = penguins) %>%
  gf_point(6 ~ 0.22, color = "red")

Try editing the code below to put a blue dot at the origin (where \(Y = 0\) and \(X = 0\)).
require(coursekata)
# modify the code to put a blue dot at Y = 0, X = 0
gf_point(body_mass_kg ~ flipper_length_m, data = penguins) %>%
  gf_point(6 ~ 0.22, color = "red")
# modify the code to put a blue dot at Y = 0, X = 0
gf_point(body_mass_kg ~ flipper_length_m, data = penguins) %>%
  gf_point(0 ~ 0, color = "blue")
ex() %>% {
  check_function(., "gf_point", index = 1) %>% {
    check_arg(., "object") %>% check_equal()
    check_arg(., "data") %>% check_equal()
  }
  check_function(., "gf_point", index = 2) %>% {
    check_arg(., 1) %>% check_equal()
    check_arg(., 2) %>% check_equal()
  }
}

Teacher Note: You can also tell gf_point() the x and y values more explicitly like this:
gf_point(body_mass_kg ~ flipper_length_m, data = penguins) %>%
  gf_point(x = 22, y = 6000, color = "red")
But a warning – a dot specified with the x = …, y = … pattern will not show up on the graph if the dot is not within the bounds of the original graph. We’ll prefer to use the Y ~ X pattern because R will automatically modify the scale of the graph to show you that point.
Using Color to Add a Third Variable to a Scatter Plot
Color can also be used to add a third variable onto a two-dimensional scatter plot. For example, let’s say in addition to their flipper length and body mass, we want to color the dots according to the sex of the penguin. We can add the variable female to the plot, which is coded 0 for male (i.e., not female) and 1 for female, like this:
gf_point(body_mass_kg ~ flipper_length_m, data = penguins, color = ~female)
Notice a few quirks about the code that comes after the color= argument. There is a tilde (~) to let R know that what is coming is not going to be just the name of a color (like "red") but something to do with variables (female). Try adding the coloring according to the variable female to the graph below.
require(coursekata)
# run this code
# then modify to color the dots by the variable female
gf_point(body_mass_kg ~ flipper_length_m, data = penguins)
# run this code
# then modify to color the dots by the variable female
gf_point(body_mass_kg ~ flipper_length_m, data = penguins, color = ~female)
ex() %>% check_function(., "gf_point") %>% {
        check_arg(., "data") %>% check_equal()
        check_arg(., "object") %>% check_equal()
    }

This is a strange pattern indeed! Although it appears that females (the purple dots) have lower body mass on average than the males (the teal dots), it seems strange that this pattern appears to be repeated twice, once in a clump in the lower left, and another in the upper right.
Color Subsets of Penguins Based On Values of a Variable
We can also use color to highlight a subset of penguins based on their body mass. For example, the code below renders penguins with a body mass equal to 4 kg in one color and the rest of the penguins in a different color.
gf_point(body_mass_kg ~ flipper_length_m, data = penguins, color = ~(body_mass_kg == 4))
Below we show the original scatter plot without the special coloring.

Now that you’ve made a prediction, modify the code below to color the penguins that have a body mass equal to 4 kg.
require(coursekata)
# modify this code
gf_point(body_mass_kg ~ flipper_length_m, data = penguins, color = ~(body_mass_kg == ))
# modify this code
gf_point(body_mass_kg ~ flipper_length_m, data = penguins, color = ~(body_mass_kg == 4))
ex() %>% check_function(., "gf_point") %>% {
        check_arg(., "data") %>% check_equal()
        check_arg(., "object") %>% check_equal()
    }

The color argument, color = ~(body_mass_kg == 4), has a tilde (~) to let R know that a variable is coming (body_mass_kg). Instead of just a variable, however, this time we are using a variable expression to specify penguins that have a body mass exactly equal to 4 kg. For penguins with a body mass of exactly 4 kg, R will return the value TRUE. For all other body masses, R will return the value FALSE. We added optional parentheses to show that this part, (body_mass_kg == 4), is a variable expression.
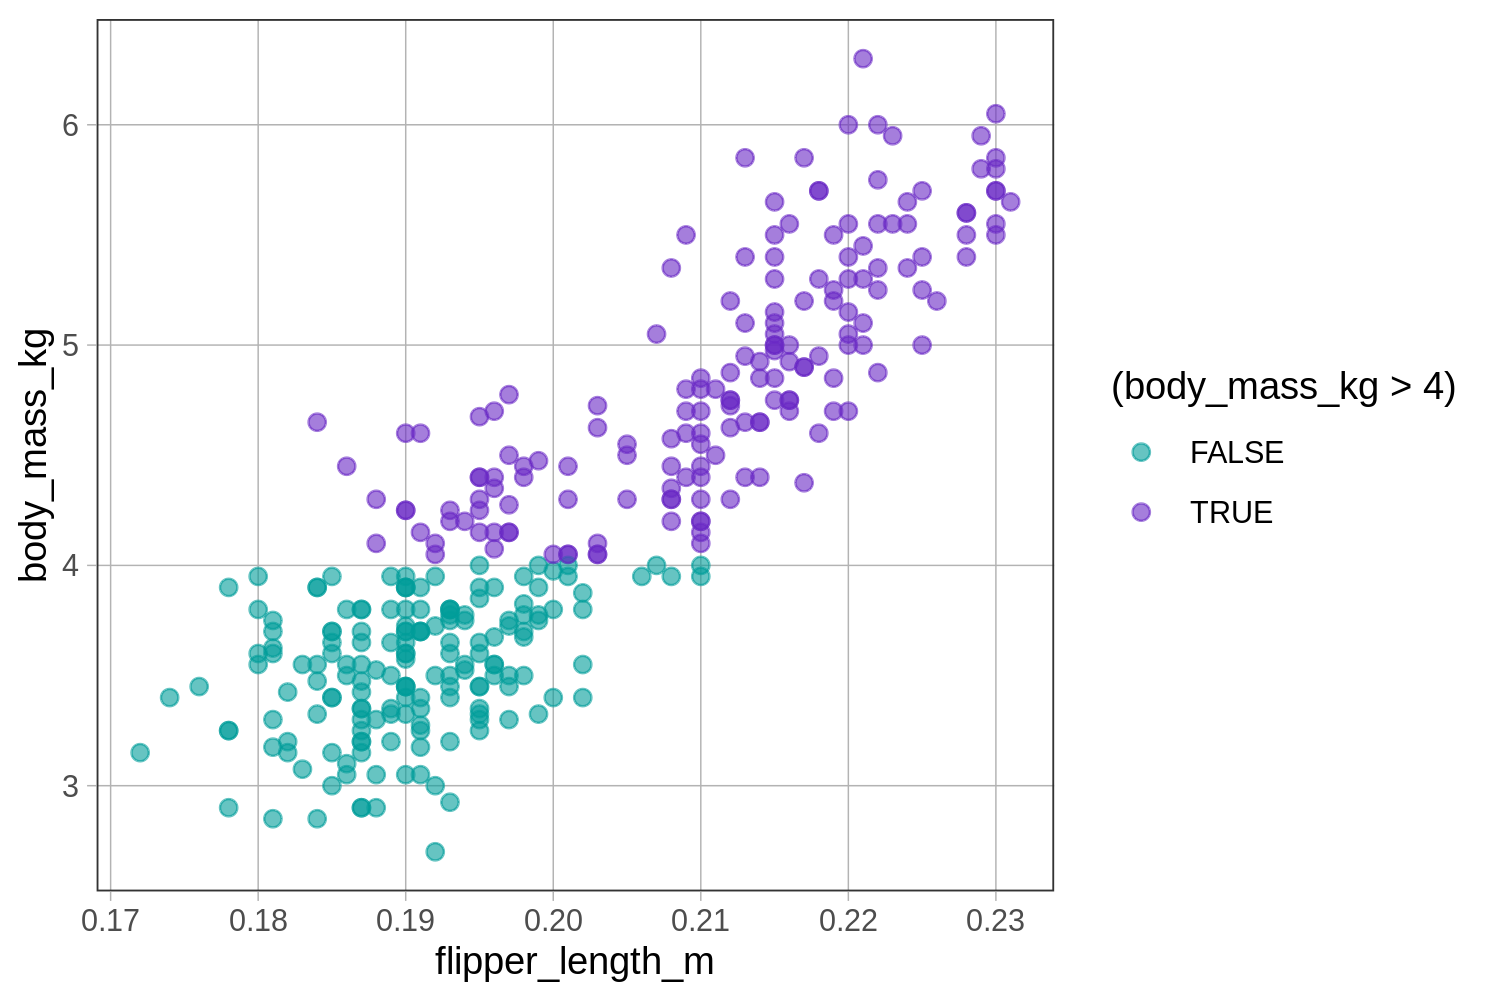
Now try modifying the code to color the penguins that have a mass greater than 4 kg in a different color. (Note: The greater than sign is just > in R.)
require(coursekata)
# modify this code
gf_point(body_mass_kg ~ flipper_length_m, data = penguins, color = ~(body_mass_kg == 4))
# modify this code
gf_point(body_mass_kg ~ flipper_length_m, data = penguins, color = ~(body_mass_kg > 4))
ex() %>% check_function(., "gf_point") %>% {
        check_arg(., "data") %>% check_equal()
        check_arg(., "object") %>% check_equal()
        check_arg(., "color") %>% check_equal()
    }
Modify the code below to color the penguins with a flipper length less than 0.20 in a different color.
require(coursekata)
# modify this code
gf_point(body_mass_kg ~ flipper_length_m, data = penguins)
# modify this code
gf_point(body_mass_kg ~ flipper_length_m, data = penguins, color = ~(flipper_length_m < 0.20))
ex() %>% check_function(., "gf_point") %>% {
        check_arg(., "data") %>% check_equal()
        check_arg(., "object") %>% check_equal()
        check_arg(., "color") %>% check_equal()
    }
